|
Grafiken Temperatur (Jährliche)

Grafiken Luftfeuchtigkeit (Jährliche)

Grafiken Athosphärendrucks (Jährliche)

Grafiken Windes (Jährliche)
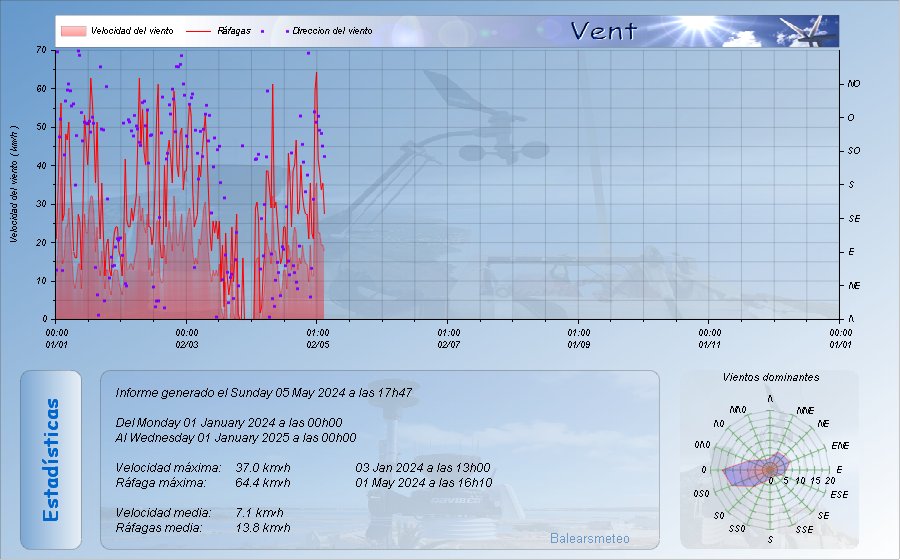
Grafiken Windrichtung (Jährliche)

Grafiken Solarstrahlung (Jährliche)

UV-Strahlen
Grafiken (Jährliche)

Grafiken Wolkenhöhe (Jährliche)
|


 Nota:
L´estació masura aquesta Temp. només si supera els 25ş C
Nota:
L´estació masura aquesta Temp. només si supera els 25ş C