Station Data

Home

Real Time Data

Current Weather

Today´s Datailed Data

Console VP2 Live

Weather Display_Live

Current Data for Phone

Temperature Sensors

Graphs

Monthly Graph

Graph Annual

Precipitation Graph

Statistics

Records

NOAA Comparative

Interactive Comparative

Soil Sensors

Soil Current Data

Soil Temperatures Graphs

Soil Moisture Graphs

Evapotranspiration

Current Weather

WebCams

Balearic Weather Stations

Satellite Images

 Worldwide Satellite

Radar

 Radar Animation

Ligthning Activity

Sea Temperatures

Marine Buoys Data

Earthquakes

Sun and Moon

Moon Phases

Forecasts

Forecast Portocolom

Forecast Palma

Majorca Towns Forecast

Meteogram Portocolom

Meteogram Palma

Balearics Islands Forecast

UV Forecast

Weather Warnings

Storms Forecast

Isobaric Forecast

Temperatures Maps

Precipitations Maps

Models

Marítime Forecast

Current Sea Conditions

Maritime Forescast Models

Maritim. Newsletter Forecasts

Forecast Beaches

External Links

Interesting Links

Meteodemallorca

Meteoclimatic

Taxis Portocolom

Servicios Barcelo

Benzinera des Port

Several

Fotographs

Banners

Location and Contact

Station Description

Geographical Situation

Guestbook

Contact

Social Links


Data for Iphone/Android


   Balearsmeteo
   
Real-time data Weather Stations (every 10 seconds)

SOMIB


Villas en Mallorca

PropagationStats

Activitat Solar
My Ham call is EA6DL

 
If you want to help the maintenance of the Station and its information, you can make donation, Thanks!
,


Temperature Sensors


Temperature diference between a 1,50 meters and 7 metres

          Temperature sensor at 1,50 m.                                    Temperature sensor at 7 meters

                  
                                     Data are from the present day and are updated every 5 minutes


Today´s Temperature Graph (Màx. i Min.) 1,50m.          Today´s Temperature Graph (Màx. i Min.) a 7m.
 

.
 Monthly Temperature Graph (Max. i Min.) at 1,50m.      Monthly Temperature Graph (Max. i Min.) at 7,0 m

  Yearly Temperature Graph (Max. i Min.) at 1,50m. .         Yearly Temperature Graph (Max. i Min.) at 7,0 m.


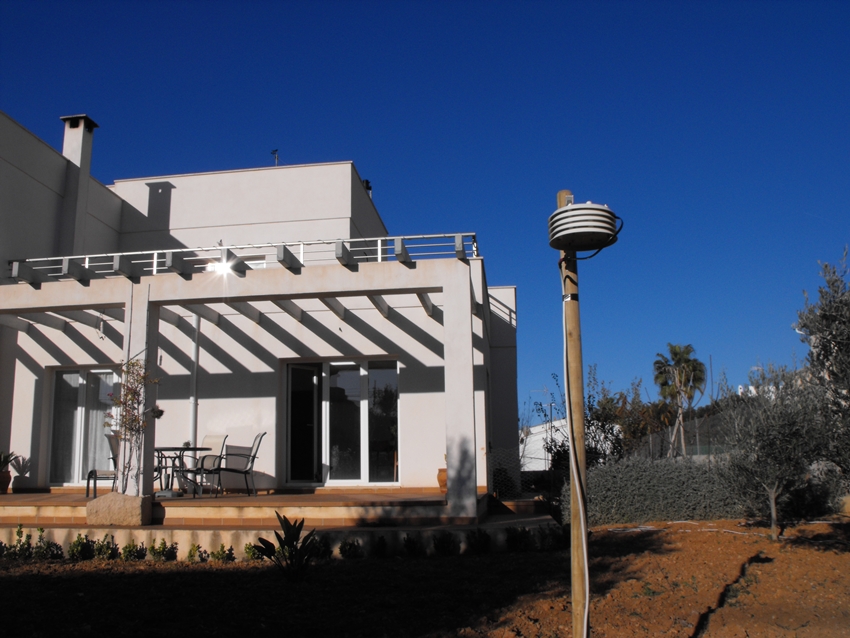
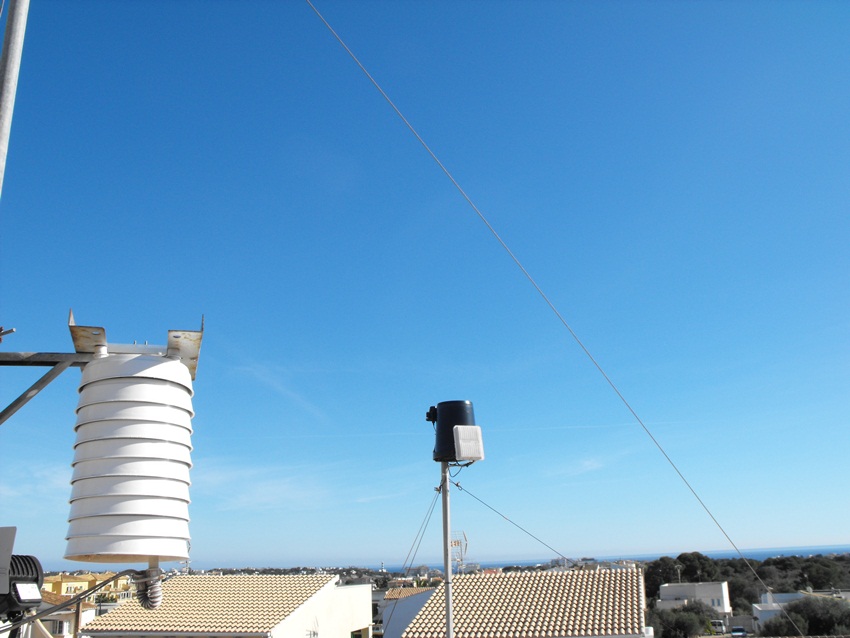
 Starting the January 1st 201, Meteoportocolom provides a Termo-Higrometer sensor from the davis Station 1,50 meters aborc the ground, according to the rules of the World Meteorological Organization (WMO). To reep the measured data of the year 2009 2010 and 2011 and to be able to contrast the temperature of the sensor from the terrace between (7 meters) and 1,50 meters from the ground, I installed a Termo-higrometer "Lacrosse" netx to the Davis Station. These sensors were tested and the variation was -0,1º C practically identical.

In thermal invercion nights, clear skies and calm nights (as we know the cold air accumulates at the lower parts), the temperature measured at 1,50 meters can be reached be up to 4º C lower than that measured 7 meters high, in the case of Meteoportocolom.

In the summer during the day, the temperature measured 1,50 meters in the central hours of the day on sunny day can be up 3º C above  the temperature measured on the terrace at 7,0 meters  where these is always more airy.


      Sensor de temperatura "Davis" a 1,50 metres             Sensor de temperatura "Lacrosse" a 7 metres (terrat)


Estació Davis Vantage Pro 2 Plus + estació agricola - Weatherlink 6.0.0 -Weahterdisplay 10.37R - GraphWeather 3.0.15
© 2011-2014, Meteoportocolom y Mallorcared - Webmaster Jaume Mas Ferrer;

Atenció! Les dades meteorològiques publicats en aquest lloc són d'una estació meteorològica personal i són només indicatius, que en cap cas podran ser utilitzats per assegurar la protecció de les persones o els béns.


METEO TOP-10

World Weather Websites

Meteoclimatic